Twin straight from the drawing
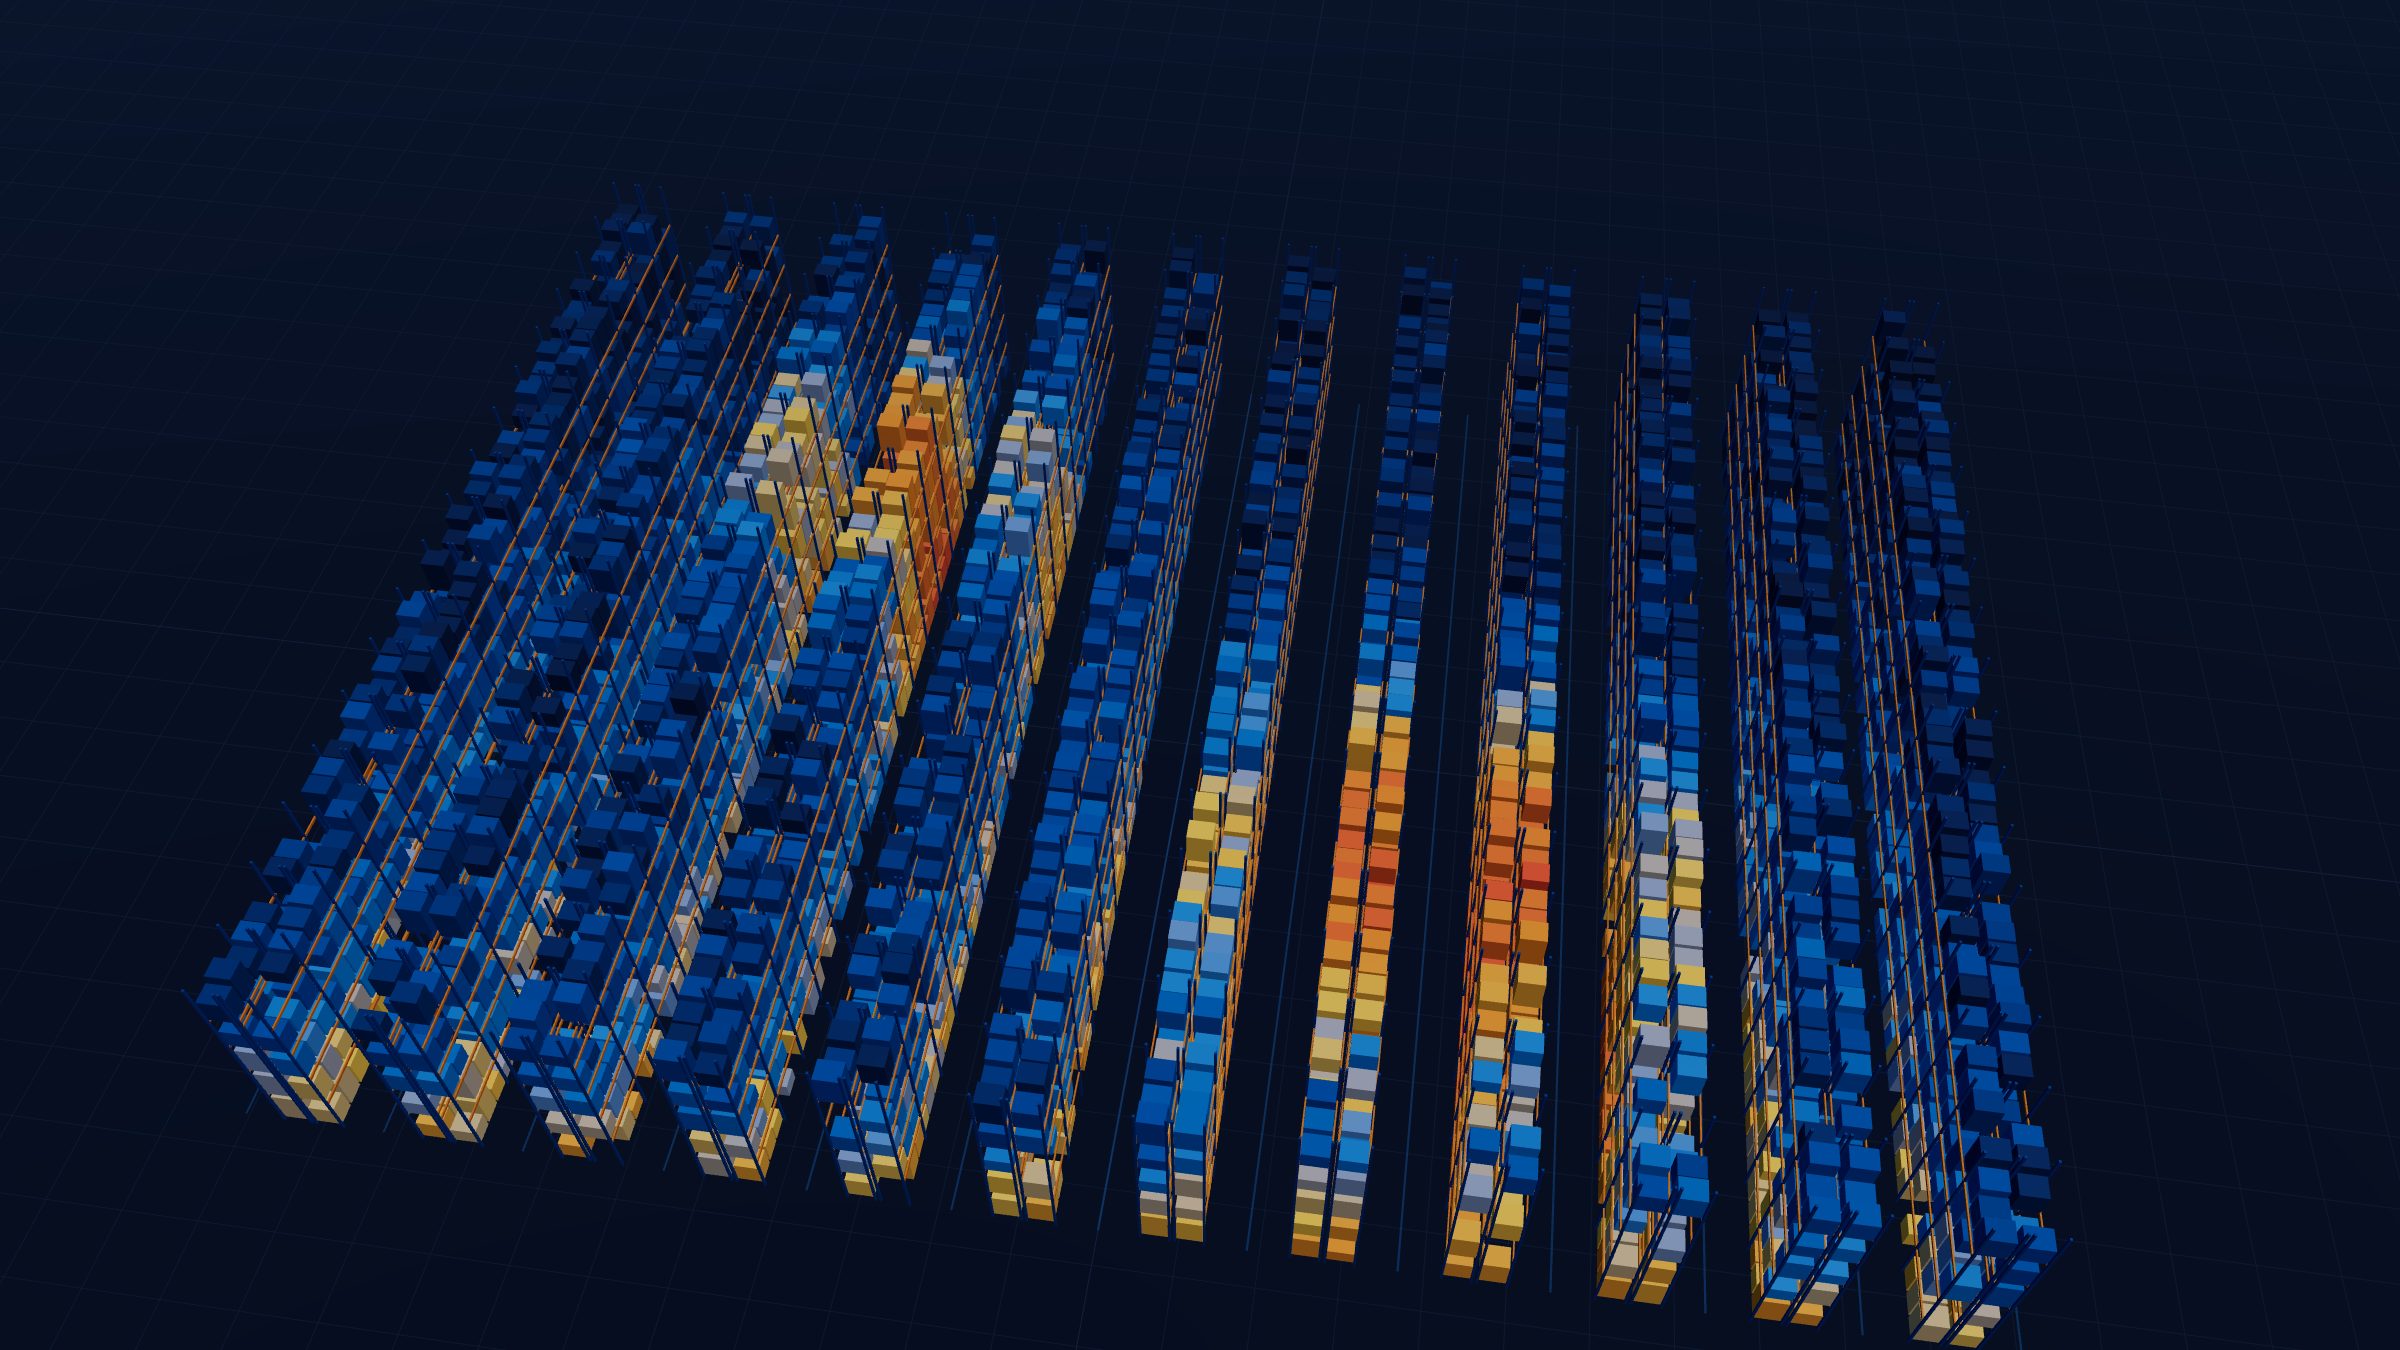
Aisles, bays, levels and the scale of the hall are read from the design documentation. The model is ready in days, not weeks of manual surveying.
Fast start, no site survey
From the digital twin through flow analytics and pick path optimisation to capacity planning and data security.
Innovations shown: 40
Aisles, bays, levels and the scale of the hall are read from the design documentation. The model is ready in days, not weeks of manual surveying.
Fast start, no site surveyStorage location codes from your ERP are mapped to a specific aisle, bay and level. The matching rules are documented and verifiable.
One truth about where stock isEach pallet is shown at its real position and height based on the volume it occupies, floor locations included.
The warehouse readable at a glanceSwitch utilisation bands for bays and levels with a single click, in the floor plan and in space.
Free capacity visible instantlyWe automatically find negative stock, items larger than their location, orphaned locations and mismatches between records and the physical layout.
Cleaner data in your ERPReceiving, cross-dock and picking zones are a full part of the model, not a blind spot of the analysis.
The entire flow of goods in one viewThe state of the warehouse is stored day by day. Compare any two moments and see what changed.
Evolution instead of a single photoPicks, put-aways and transfers shown on specific bays and levels, with a month-by-month slider.
See where the warehouse really worksThe data shows which parts of the hall serve fast picking and which hold reserve stock, often differently from the original design.
Decisions based on realityThe direction of every transfer, from where and to where, is verified by location balances, not guessed from the document description.
Reliable flows of goodsHow much picking happens at floor level and how much at height, by aisle and by item.
A basis for ergonomics and equipmentItems classified by pick frequency and demand stability, calculated from documents rather than estimates.
The right item in the right placePeaks of days, weeks and months on a single timeline. Shift planning backed by data.
Staffing matched to demandKey indicators for the last closed month are prepared automatically and can be compared with previous periods.
Management without manual reportsThe original zoning and the designer's assumptions are compared with how the operation really runs. What does not hold up, we name.
Fewer investments made blindDistances are calculated along the actual aisles and cross-aisles of the hall, not as the crow flies.
Exact figures instead of estimatesThe picking sequence within an order is recalculated for the shortest route. In the pilot analysis, the travel distance fell by 35%.
Up to a third fewer kilometresOrders with nearby locations are combined into a single trip. The gain is largest for piece picking.
More orders per tripFast movers are moved to ergonomic levels. In the pilot analysis, lifting time dropped by 27%.
Fewer lifts, less fatigueEvery re-slotting proposal is first tested on historical data. We recommend it only when it truly helps in that particular hall.
No change for the sake of changeThe original and the optimised route side by side in the space of the hall. Everyone understands the difference, from the picker to the board.
Change people understandThe result is converted into kilometres per day and working hours per year at your speeds and rates.
Benefit in euros, not percentagesWe show how the result changes with different speeds, rates or volumes. You see both the certainty and the risk of a decision.
Decisions made with eyes openThe movement of goods throughout the day is reconstructed from documents, even when the records do not store the exact time of each movement.
Operations as if on cameraFrom the reconstructed day we calculate how many trucks and people are enough to finish the shift on time.
A fleet sized to needExport a day or a month as a 2D or 3D video and as a summary PDF for the meeting.
Materials in one clickIntegration of truck and scanner location: live position, trail and aisle load.
What is happening right nowLocation status is synchronised from the ERP continuously. The twin matches the warehouse, not last week's export.
Current state without exportsReplay the same day with the current and the proposed setup and compare time, distance and utilisation.
Validated before roll-outAdd new aisles and levels to the model and instantly see the impact on capacity, routes and accessibility.
Investment validated in advanceAt what volume the warehouse hits its ceiling, and what helps sooner: new racks, different zoning or a different work sequence.
A plan for years aheadPallet dimensions and weights are compared with location parameters. We find risks as well as unused space.
Safety and better utilisationSavings, costs and payback in one document, always from current data and with recommendations ranked by benefit.
A basis for the investment decisionPresentations and reports are generated from the same data as the twin. Figures in documents never go stale.
One version of the truthWe connect to your ERP strictly read-only through its API. We never write anything to your systems.
Zero risk to your recordsOperational data is processed on dedicated infrastructure in the European Union and is not shared with third parties.
GDPR and policy compliantEvery user has a personal account with a password and an authenticator app, recovery codes and lockouts against password guessing.
Access for authorised people onlySign-ins, exports and changes are logged in a structured format, ready to be connected to a SIEM.
Ready for NIS2The interface is protected by a gate that detects bots and requires computational proof. Your data cannot be downloaded in bulk.
Your know-how stays yoursSign-ins, locked accounts and suspicious activity are reported immediately to the people responsible.
Incidents caught in minutesWe look at your data and rank the measures by benefit. No obligation and no disruption to operations.